Skip to content
Free economy freight over $3,500Minimums from 50 units per SKUWire transfer above $2,000
0

Market opportunity

A large category, and a shelf still mostly empty

Wall art is a mature category that keeps growing — but almost all of it is abstract, botanical or typographic. Chinese reference charts are a defined niche inside it, and one with very little wholesale supply.

The trade in one line

Take a 30 × 40 cm chart as the example: $8.00 per unit at the 12-unit entry tier, against a $30.00 retail price — $22.00 of gross margin per unit before your own costs, on a product line we hold a reference sample for and replace free of charge if it arrives damaged.

Illustrative figures at indicative wholesale levels — not a quotation. Your own tiers are confirmed per SKU on your trade account.

01

Where the numbers come from

Every category figure below comes from a named third-party research house, with its publication date and a link in the table. They scope the category differently and disagree with each other, so we show the spread rather than picking the flattering end.

Category size, 2026

US$25–72 bn

Consensus growth

≈6–7% a year

North America share

≈43.6%%

Europe share

≈31.2%%

  • Deep Market InsightsUS$24.6 bn
  • Fairfield Market ResearchUS$62.3 bn
  • Research and MarketsUS$63.7 bn
  • Fortune Business InsightsUS$70.9 bn
  • Value Market ResearchUS$71.6 bn
US$0US$62–72 bnUS$80 bn
SourceWhat it counts2026 sizeCAGR
Deep Market Insights2026Canvas, framed, metal, posters and textile artUS$24.6 bn6.1%
Fairfield Market ResearchMay 2026Wall décor incl. wallcoverings, hangings and shelvesUS$62.3 bn6.3%
Research and MarketsJan 2026Factory-gate: paintings, prints, murals, tapestriesUS$63.7 bn7.0%
Fortune Business InsightsFeb 2026Paintings, prints, photographs, murals, digitalUS$70.9 bn9.4%
Value Market Research2026Wall décor incl. wallpapers, stickers and coveringsUS$71.6 bn6.0%

The spread has two causes. Scope: some houses count wallcoverings, murals and shelf décor, others count prints and framed art only. Method: some report factory-gate value, others report retail, so the figures are not directly comparable. One house sits well below the rest; the other four cluster between US$62 bn and US$72 bn, and that band is the one to plan on. They also disagree about which region leads — Fortune Business Insights puts North America first, Fairfield and others put Asia-Pacific first. Both readings can be right on different definitions, and neither one changes what you are actually deciding. For a buyer the useful signal is direction: mid single-digit growth, year after year.

02

What the category is actually made of

Two published figures describe most of it. Abstract work is about 30.5% of the category measured by type, and canvas is about 45.1% measured by material. Both are commodity shelves: hundreds of suppliers can fill them, and once a design is a grey rectangle the buyer’s only remaining lever is price. Reference charts sit outside that comparison. A dated dynastic timeline or a twenty-eight-mansion star chart is not a poster you can swap for another poster — and that is the whole commercial argument for stocking one.

Abstract and canvas shares: Fortune Business Insights, Wall Art Market, 2026. The reference-chart figure is our own catalogue, not a market estimate — no research house publishes a size for this niche, and we are not going to invent one for a page like this.

Abstract — share of category by type30.5%
Canvas — share of category by material45.1%
Chinese reference charts — our catalogue14 SKU

Type share and material share measure the same market on two different axes, so these bars overlap rather than adding up to 100%.

03

Four reasons the demand is structural, not fashionable

Every figure below comes from a named publisher with a date, and every one of them is a measurement rather than a forecast. None of these arguments depends on a trend continuing.

Channel

Online is where the growth is, and it is growing about twice as fast as retail

Shoppers are moving online faster than retailers are.

US e-commerce reached 17.1% of total retail sales in the second quarter of 2026, up from 16.3% a year earlier. Online sales grew 12.2% year on year; total retail grew 6.7%.

US Census Bureau, Quarterly Retail E-Commerce Sales, August 2026.

If you sell online, your assortment gets compared rather than browsed — a screen makes price-matching effortless. The only durable defence is a product nobody else on that screen stocks.
Institutions

There is a buyer who reorders on a timetable, not on a trend

Reference charts are teaching material, and teaching material gets replaced.

The United States has about 99,073 operating public schools with roughly 49.3M students, and about 35,144 museums and historic institutions — nearly half of them historical societies and historic sites.

NCES Common Core of Data (schools); Institute of Museum and Library Services, Museum Universe Data File (museums).

A classroom, a museum shop or a library reading room buys in units, and comes back when a chart fades, a display rotates or a periodisation is revised. That is a repeat order you can plan a year around — which a design trend will never be.

Retail

Independent retail is consolidating onto assortment, not price

The number of gift shops is falling while the money they take is holding.

The US gift-shop and card-store channel runs to about 52,999 businesses turning over roughly US$23.9 bn a year. The store count has fallen about 2.5% a year over five years, while revenue is essentially flat.

IBISWorld, Gift Shops & Card Stores in the US, January 2026.

Fewer shops, each keeping a larger share of what is left. The ones still trading are the ones whose assortment a chain cannot copy. That is the shelf we are trying to get onto — and the reason a differentiated product is worth a test order.

Geography

The two regions we ship to are the two that spend

North America and Europe are where the category’s retail money sits.

North America holds about 43.6% of the category and Europe about 31.2% — together roughly three quarters. They are also the two regions our freight zones are priced for.

Fortune Business Insights, Wall Art Market, 2026.

No re-export, no triangulation, no surprise freight zone. You buy in the region you sell in.

04

Where it sells

North America and Europe together take roughly three quarters of the category, and they are the two regions our freight zones are priced for. Online is the fastest-growing sales channel — which is where most of the retailers we supply actually compete.

Why reference charts, specifically

Roughly 30% of the category is abstract work and about 45% is canvas — both commodity shelves, available from hundreds of suppliers. A dated dynastic timeline or a twenty-eight-mansion star chart is not interchangeable with anything else on the wall.

It is also a category that gets reordered for reasons other than fashion: a school replaces a chart it has used for years, a museum shop restocks for an exhibition, a course reading list stays the same. That is a better repeat-purchase profile than a design trend.

05

Who buys this, and what the smallest sensible order looks like

Four channels account for almost all of our trade. Find yours — the right first order is different for each.

Museum & heritage shops

35,144

museums and historic institutions in the US · IMLS Museum Universe Data File

What they buy
A print that supports an exhibition, a collection or a regional history — and that a visitor can carry home.
Why it fits
A dynastic timeline is explanatory text as much as decoration. It does the label-writing a small shop would otherwise do itself, in a language the visitor actually reads.
Smallest sensible first order
One theme at its 12-unit minimum. The 48-unit tier is where the per-unit price moves enough to matter.

Independent gift & souvenir shops

≈53,000

US gift and card stores, about US$23.9 bn a year · IBISWorld, January 2026

What they buy
One or two designs bought deep and reordered, rather than a wide range bought thin.
Why it fits
An imported, ready-to-hang chart with consistent labelling is a product the shop two streets over does not have — and a souvenir that is not a fridge magnet.
Smallest sensible first order
12 units of a single theme to test the wall, then a reorder at 48 to take the better price.

Schools, libraries & educators

≈99,000

US public schools, about 49 million students · NCES Common Core of Data

What they buy
Classroom quantity of one chart — the same piece repeated, at a size a whole room can read.
Why it fits
Curriculum does not churn. A periodisation or a reading list stays the same for years, so a chart that works keeps working.
Smallest sensible first order
Mix sizes inside one order — 70 × 100 cm for the front wall, 30 × 40 cm for desks — and stay inside whole case packs.

Online sellers, stylists & studios

17.1%

of US retail sales now happen online · US Census Bureau, Q2 2026

What they buy
Small mixed quantities to photograph, then depth on whatever the numbers say is working.
Why it fits
Flat and light, so it ships cheaply, and it photographs well because the artwork carries the frame. Unframed is the cheapest way to test a design.
Smallest sensible first order
The cart minimum spread across three or four SKUs — enough to shoot properly, few enough that nothing becomes dead stock.

The buyers already exist

You do not have to create a market for this. The US gift and card store channel alone runs to about 52,999 businesses turning over roughly US$23.9 bn a year — and it is consolidating. The store count has fallen about 2.5% a year over five years while revenue held flat, which means fewer shops, each keeping a larger share of what is left. Those are exactly the buyers who stock in cases rather than containers, and reorder when a line works.

US gift & card stores

52,999

Combined annual revenue

US$23.9 bn

Store count, 5-year trend

−2.5%

06

Why the shelf is still thin

This is not a trade secret and it is not a patent. It is simply more work than a commodity print. Every chart needs a periodisation someone will stand behind, labels that survive being read by someone who does not read Chinese, and a print run that still matches its reference sample a year later. Most factories will not take that on, and the ones that will are not set up to sell twelve units to a shop.

What we have done about it, in figures you can check on this site:

  • 14 SKUs across four themes and three sizes, each available in up to three formats — print only, hanging scroll and framed.
  • Offset litho on 240 gsm matte art paper over a rigid board core, with UV-cured pigment inks for a low-glare finish. Frames are kiln-dried pine in natural oak or matte black.
  • A hanging kit in the box, a stated lead time on every product page, and a reference sample held for every SKU that each production run is checked against.
  • Commercial invoice and HS coding (4911.91) prepared for every shipment, so your broker can clear it without chasing us.

07

The margin, worked

This is the arithmetic a buyer actually runs. The figures below are a worked example at indicative wholesale levels — not a quotation, and not our price list. Your own tiers are confirmed per SKU on your trade account.

You pay, entry tier$8.00
Your retail price$30.00
Gross margin per unit$22.0073.3%
First order, 12 units$96.00

Margin is stated against the retail price you enter, before your own overheads. Freight is estimated on chargeable weight at checkout and confirmed before production.

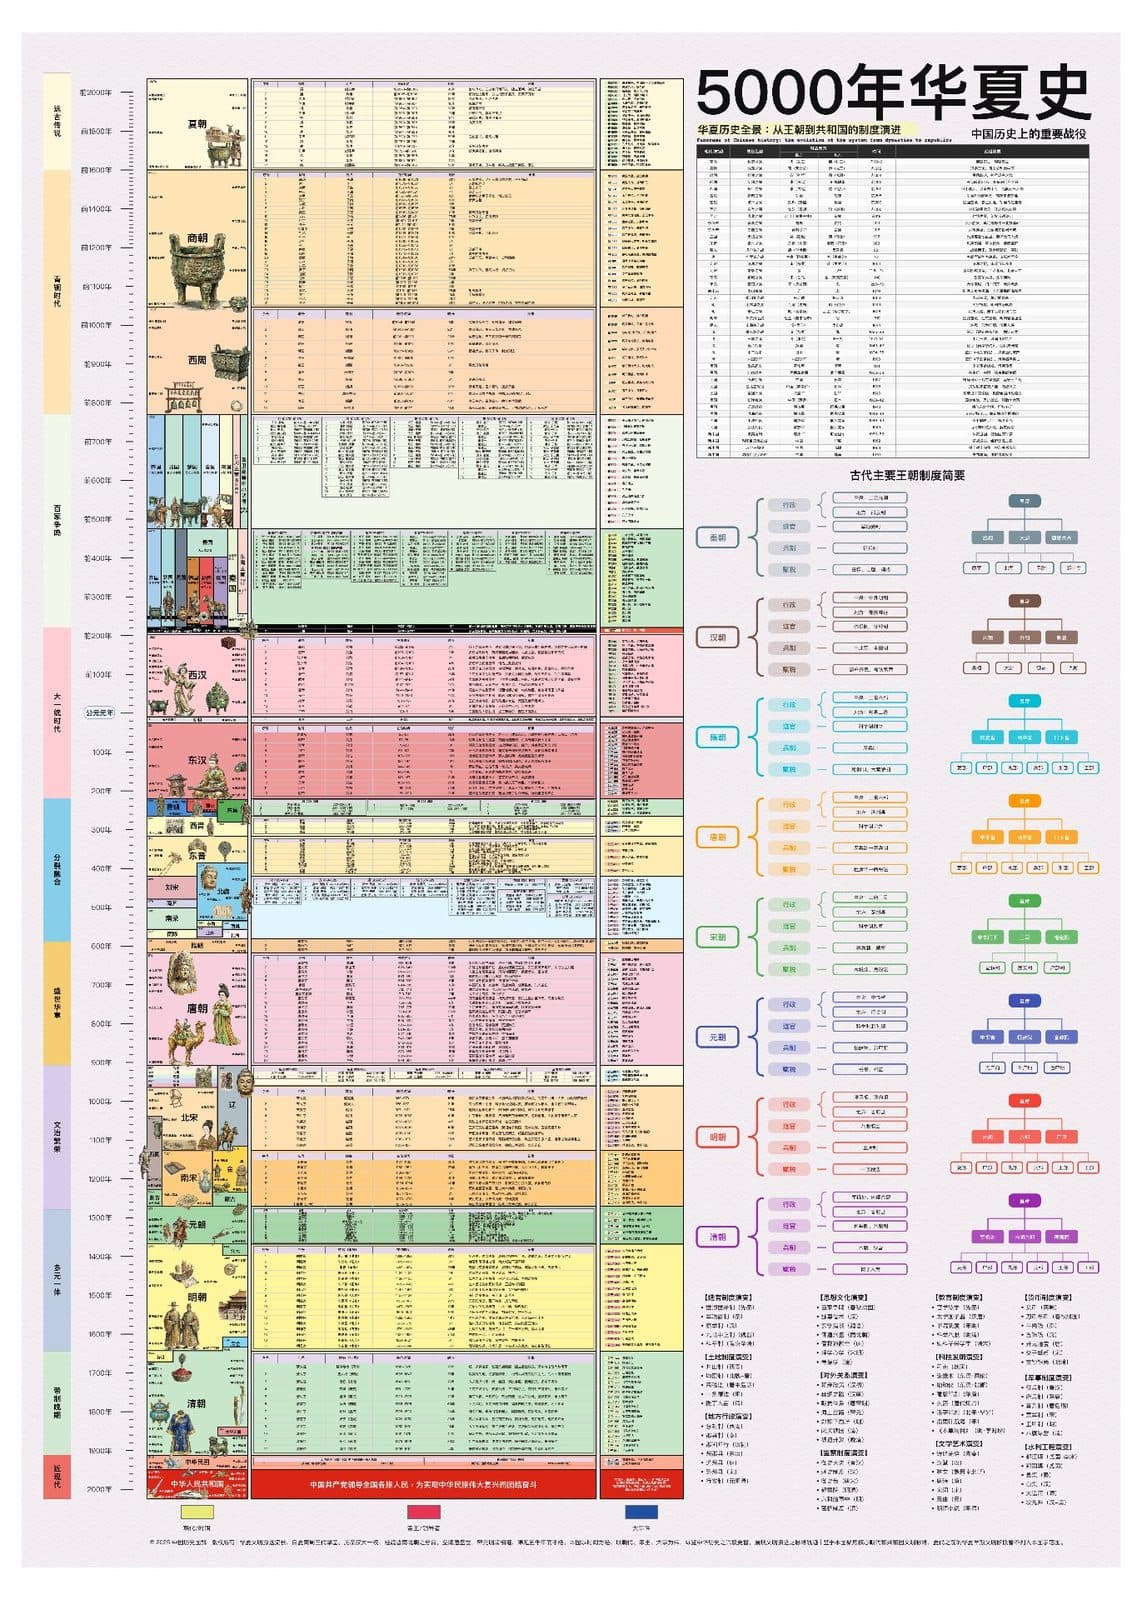
Five Thousand Years of Chinese History — full chart
Five Thousand Years of Chinese History — 30 × 40 cmKP-HIS-3040

The margin, on your numbers

Everything below is arithmetic on an example wholesale ladder — indicative, not a quotation. Change the quantity or your own retail price and the figures move with you.

Quantity
$

Starts at the retail price used in this example — type your own to see your actual margin.

You pay per unit

$8.00

Entry tier · 12

Margin per unit

$22.00

73.3% Margin

Cost of this order

$96.00

Profit if it all sells

$264.00

How long one order lasts

If you sell (units a week)Then reorder
112 weeks
34 weeks
62 weeks
121 weeks

The same order at three sell-through rates. This is division, not a demand forecast — put your own weekly number in.

Calculated at the 12-unit entry tier. Reordering inside the 48-unit tier lowers your unit cost, so a faster rate pays for itself twice.

Example figures at indicative wholesale levels — not a quotation. Margin is stated against the retail price you enter and excludes your own overheads, payment fees, and the duties and import taxes payable by you as consignee. Freight is estimated on chargeable weight at checkout and confirmed before production.

08

How a first order actually runs

Every figure in this section is a published term from our trade pages — not a promise written for this page.

  1. 01

    Open an account

    Free, with no minimum spend, no credit check and no approval wait. Sign in with a business email and the full wholesale tier table appears on every product page.

  2. 02

    Order a sample, if you want one

    A mixed pack is three to five SKUs at their own minimums. It is the cheapest way to judge paper, colour and weight — on your own wall rather than on our screen.

  3. 03

    Place the order

    Each line must clear its own minimum and be a whole multiple of its case pack; the cart enforces both before checkout. A first order is reviewed by a person within one business day — a specification and fraud check, not a credit check — and quantities can be changed free of charge until it is released.

  4. 04

    We produce

    About 7 business days from payment or transfer confirmation, and every product page states the lead time for that SKU.

  5. 05

    Freight is quoted, then confirmed

    Charged on chargeable weight — the greater of actual and volumetric (L × W × H cm ÷ 5,000) — at published zone rates, and shown in the cart before you pay. Economy freight is included from US$3.5 k. Shipments go DAP, so duties and import taxes are payable by you.

  6. 06

    If something arrives damaged

    Photograph the carton and the piece within seven days and we replace the units free of charge, including freight. We do not ask for the damaged goods back.

09

What this page does not claim

A page like this is easy to inflate. Here is exactly where our evidence stops.

We do not know your sell-through.
Nothing here tells you how quickly these will sell in your shop. The category data is third-party, the margin arithmetic is ours, and the demand is yours to test.
The market figures are not ours.
Every category number is quoted from a named publisher with a date and a link you can open. They disagree with each other, and we show the disagreement rather than averaging it into a figure that looks tidier than the evidence.
The margin is before your costs.
It is calculated against the retail price used in the example and excludes rent, staff, payment processing, and the duties and import taxes you pay as consignee. Your real number will be lower than the one on this page.
Freight is an estimate until it is confirmed.
Weight and zone are known at checkout; the final charge depends on what actually ships, and we confirm it with you before production starts.
We do not promise exclusivity.
Nothing on this page grants you a territory. If an exclusive is what you need, say so in your first message and we will tell you plainly whether we can do it. Custom sizes and private label are handled case by case — the contact form has a topic for both.

Start with a sample, not a container

A mixed sample pack is three to five SKUs at their own minimums — enough to judge paper, colour and weight on your own wall before you commit shelf space, and the only honest way to find out whether this sells where you are.

Opening an account is free and instant, with no minimum spend and no credit check.